
Properly collecting drone flight data allows you to achieve survey-grade photogrammetric accuracy in Terrain Creator. In this article, we'll use two test sites (using both RTK and PPK respectively) to prove that processing your dataset with at least one Ground Control Point (GCP) on the project site is a quick and effective way to achieve survey-grade accuracy. We'll also show how the type of ground cover can influence the level of accuracy you can achieve.
Overview
- Methodology: Check Your Results Using Check Points
- Test Site 1: Drone Survey with an RTK Flight
- Test Site 2: Drone Survey with a PPK Flight
- Conclusion
Methodology: Check Your Results Using Check Points
Our method for validation of our dataset was to measure the accuracy by comparing the resulting terrain with check points. To do this, we used a different number of GCPs during the photogrammetry process to create a few different datasets of the same site. We then moved those datasets into Virtual Surveyor to measure the resulting Root Mean Square Error (RMSE) from both the vertical and horizontal accuracies on the actual terrain model.
Test Case 1:
- We used 120 points without ground markers to measure vertical accuracy.
- Another 5 points were used as the GCPs for processing the photogrammetry.
Test Case 2:
- We used 13 points without ground markers to measure vertical accuracy.
- Another 5 points were used as the GCPs for processing the photogrammetry.
As part of our method, we validate the elevation errors using an RMSE because it gives the best representation for the distribution of error around a baseline 0.00 m in a projected coordinate system. See the table below for an example of using errors for validation:
| Error Values | Average Error | RMSE |
| -8 cm, +6 cm | -1 cm | 10 cm |
| -1 cm, -1 cm | -1 cm | 1.4 cm |
Test Site 1: Drone Survey with an RTK Flight
Location: Texas, United States
GPS: RTK
# of GCPs Used: 5, 1, 0
| Drone Used | Camera Resolution | Number of Photos | Ground Resolution | Data Size |
| DJI - Mavic 3 Enterprise | 20 MP | 442 | 0.05 m | 6 GB |
Using the information above, this project was photogrammetrically processed three separate times using 5, 1, and 0 GCPs for each dataset, which will all be used for this test to see how the number of GCPs can influence the accuracy of your dataset. After processing the three datasets, we moved them to Virtual Surveyor to compare the overall accuracies of the RMSE.
Dataset showing the 5 GCPs (magenta) and 120 check points (yellow).

Vertical Accuracy Results
For vertical accuracy, we tested to confirm that the generated model would be influenced by two things:
- How many GCPs we used during the photogrammetry process.
- The type of ground we placed the GCPs on.
When comparing 120 check points to the datasets produced with a different total number of GCPs:
- 5 GCPs - it yielded an average vertical error of 0.00 m and changed the RMSE accuracy to 0.04 m overall.
- 1 GCP - it put the average vertical error to 0.00 m and produced an RMSE of 0.05 m.
- 0 GCPs - we found there was an average vertical error of 0.07 m and an overall RMSE of 0.08 m.
Vertical accuracy per number of ground control points and total RMSE | |||
|---|---|---|---|
| Ground Control Points | Check Points | Average Error (m) | RMSE (m) |
| 5 | 120 | 0.01 | 0.04 |
| 1 | 120 | 0.00 | 0.05 |
| 0 | 120 | 0.07 | 0.08 |
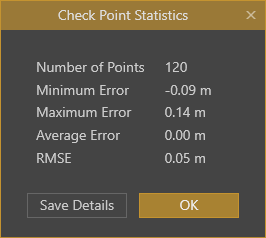
Check Point Statistics for datasets processed using 5,1, and 0 GCPs in Test Case 1 | ||
|---|---|---|
| 5 GCPs | 3 GCPs | 0 GCPs |
 |  |  |
On the dataset we processed with 5 GCPs, we tested the different ground types our check points were captured on to see what influence they had on the average error, along with the resulting RMSE accuracy.
The table below compares the different surface types that the 120 check points are found on:
- Across the entire site with all 120 check points - there was an average error of 0.01 m and an RMSE of 0.04 m.
- On Natural Ground (soft dirt) totaling 46 check points - changed the Average Error to 0.02 m with an RMSE of 0.05 m.
- Captured on asphalt totaling 30 check points - the RMSE had an Average Error of 0.00 m and a definitive survey-grade RMSE accuracy of 0.02 m.
Vertical accuracy from the type of ground the check points fall on | ||||
|---|---|---|---|---|
| Ground Control Points | Check Points | Type | Average Error (m) | RMSE (m) |
| 5 | 120 | All | 0.01 | 0.04 |
| 5 | 30 | Asphalt | 0.00 | 0.02 |
| 5 | 46 | Natural Ground | 0.02 | 0.05 |
Check Points on Asphalt

Check Points on Natural Ground

For the dataset with 0 GCPs, we corrected the average vertical error using the Offset Z feature in Virtual Surveyor to adjust the offset error by -0.07 m. Using this offset feature changed the distribution of elevation for overall accuracy of the RMSE from 0.08 m to 0.05 m.
Applying an Offset to the Average Error on the dataset using 0 GCPs | ||||
|---|---|---|---|---|
| Ground Control Points | Check Points | Offset Z (m) | Average Error (m) | RMSE (m) |
| 0 | 120 | 0.00 | 0.07 | 0.08 |
| 0 | 120 | -0.07 | 0.00 | 0.05 |
| Offset applied to the Elevation Terrain and the following Check Point Statistics in Test Case 1 | |
|---|---|
| Offset elevation by -0.07 m | Check Point Stats with RMSE of 0.05 m |
 |  |
Horizontal Accuracy Results
We verified the following check points using the measurement feature found in the ANALYSIS tab, and by visually verifying the accuracy of a check point in relation to the ground marker.
The three images below are showing, from left to right, the datasets generated using 5, 1, and 0 GCPs. In all cases the check point is either on or virtually in the center of the ground marker.
| 5 GCPs | 3 GCPs | 0 GCPs |
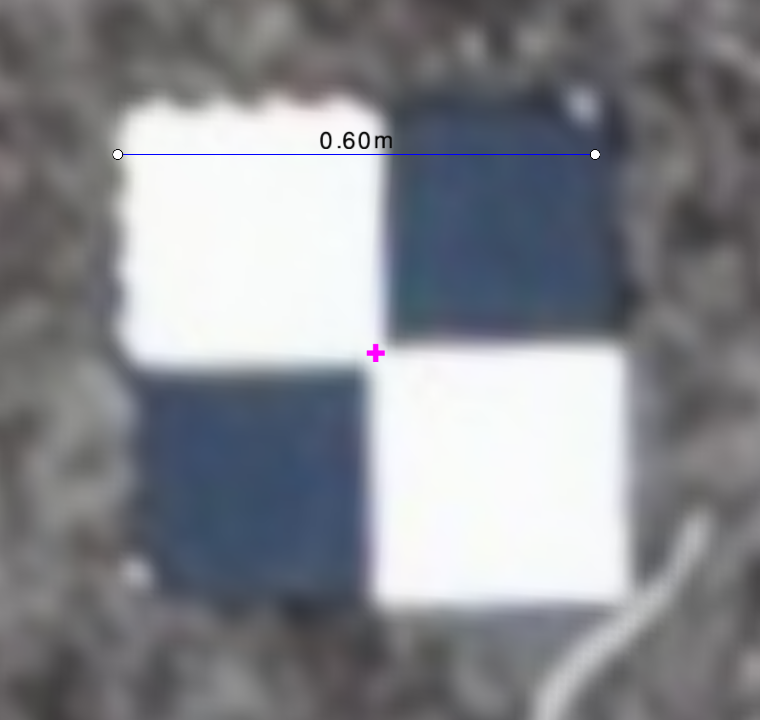 | 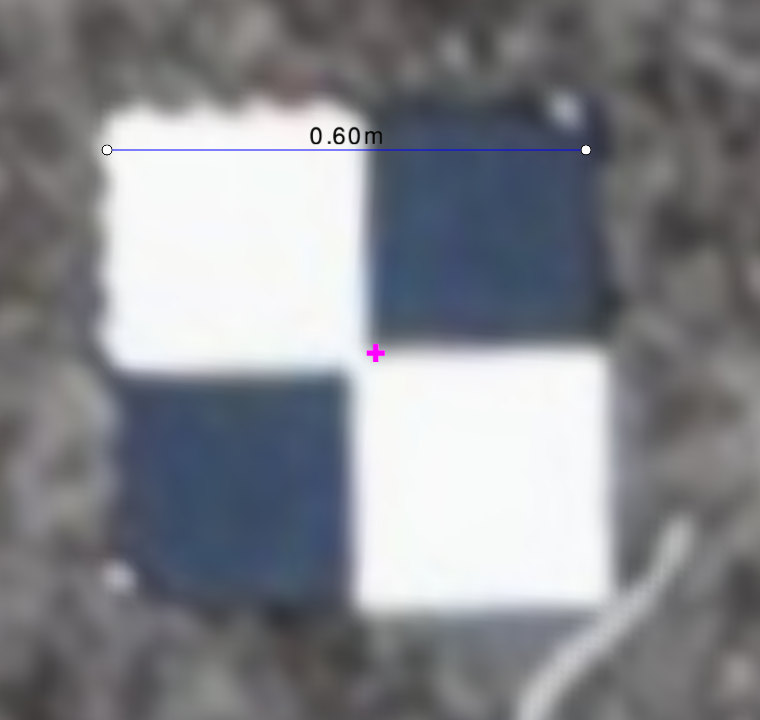 | 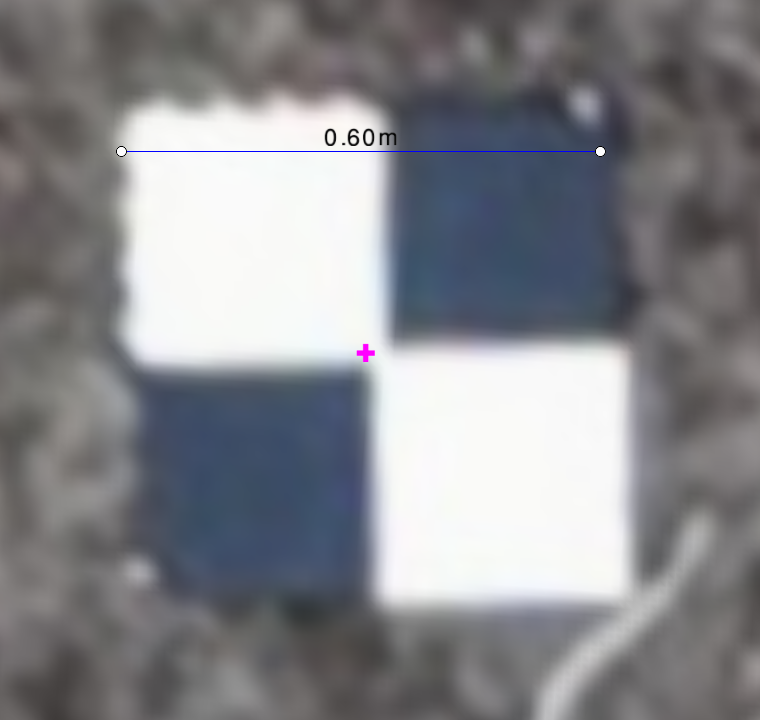 |
Test Site 2: Drone Survey with a PPK Flight
Location: Port Melbourne, Australia
GPS: PPK
# of GCPs Used: 5, 1, 0
| Drone Used | Camera Resolution | Number of Photos | Ground Resolution | Data Size |
| DJI - Phantom 4 Pro RTK | 20 MP | 155 | 0.06 m | 1.3 GB |
Using the information above, this project was photogrammetrically processed three separate times using 5, 1, and 0 GCPs, which will all be used for this test to see how the number of GCPs can influence the accuracy of your dataset. After processing the three datasets, we moved them to Virtual Surveyor to compare the overall accuracies of the RMSE.
Dataset showing 5 GCPs (Magenta) and 13 Check Points (Blue)

Vertical Accuracy Results
For vertical accuracy, similar to Test Case 1, we tested to confirm that the generated model would be influenced by how many GCPs were used during the photogrammetry process. Unlike Test Case 1, however, we had no control over where to place the GCPs for this dataset.
When comparing 13 check points to the datasets produced with a different total number of GCPs:
- 5 GCPs - it yielded an average error of 0.00 m and changed the RMSE accuracy to 0.04 m overall.
- 1 GCP - it put the average vertical error to 0.01 m and produced an RMSE of 0.05 m.
- 0 GCPs - there was an average vertical error of -0.45 m and an overall RMSE of 0.45 m.
Vertical accuracy per number of ground control points used to generate the dataset | |||
|---|---|---|---|
| Ground Control Points | Check Points | Average Error (m) | RMSE (m) |
| 5 | 13 | 0.00 | 0.04 |
| 1 | 13 | 0.01 | 0.05 |
| 0 | 13 | -0.45 | 0.45 |
Check Point Statistics for datasets processed using 5, 1, and 0 GCPs in Test Case 2 | ||
|---|---|---|
| 5 GCPs | 3 GCPs | 0 GCPs |
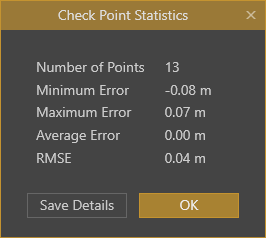 |  |  |
Check Point placement and RMSE screenshot for the model that was processed using 5 GCPs

Adjusting the offset error. For the dataset that was processed using 0 GCPs, we corrected the average vertical error using the Offset Z feature in Virtual Surveyor to adjust the offset error by 0.45 m. Using the offset feature changed the distribution of elevation for the overall accuracy of the RMSE from 0.45 m to 0.04 m.
Applying an Offset to the Average Error | ||||
|---|---|---|---|---|
| Ground Control Points | Check Points | Offset Z (m) | Average Error (m) | RMSE (m) |
| 0 | 13 | 0.00 | -0.45 | 0.45 |
| 0 | 13 | 0.45 | 0.00 | 0.04 |
Offset applied to Elevation Terrain and Check Point Statistics in Test Case 2 | |
|---|---|
| Offset elevation by 0.45 m | Check Point Stats with RMSE of 0.04 m |
 |  |
Horizontal Accuracy Results
We verified the following check points using the measurement feature found in the ANALYSIS tab, and by visually verifying the accuracy of a check point in relation to the ground marker.
The three images below are showing, from left to right, the datasets generated using 5, 1, and 0 GCPs. In all cases the check point is either on or virtually in the center of the ground marker.
| 5 GCPs | 3 GCPs | 0 GCPs |
|---|---|---|
 |  |  |
Conclusion
As the data shows, our test results prove that using GCPs during the photogrammetry process greatly helps refine the dataset for survey-grade accuracy. For both test cases, processing photogrammetry that uses either PPK or RTK with at least 1 GCP is plenty capable of accomplishing survey-grade results. We can also deduce, based on collective experience and the data of these test cases, that when processing photogrammetry using only GPS, your dataset would generally require at least 10 evenly spread out GCPs in order to obtain the same survey-grade results as RTK and PPK.